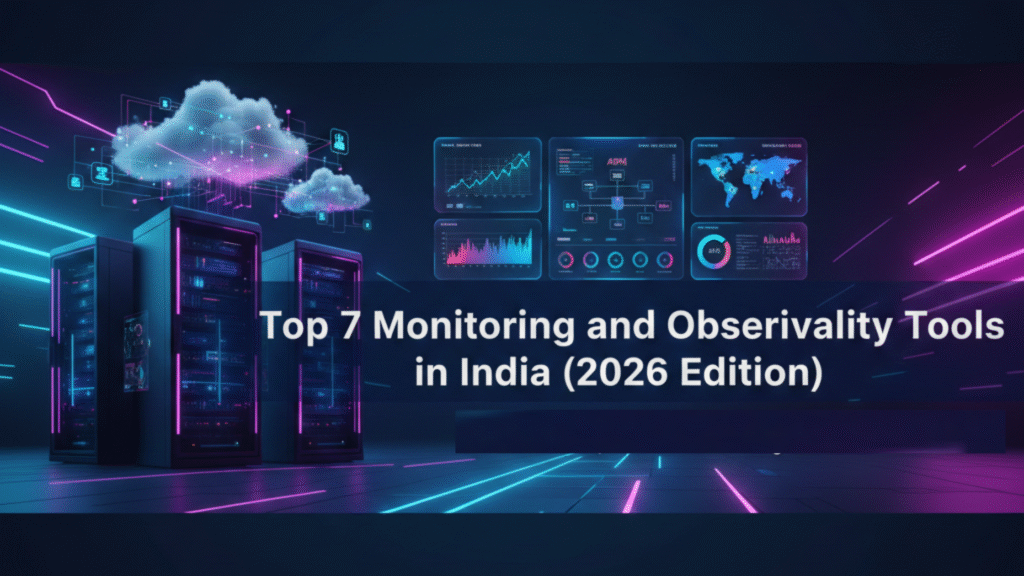
Modern digital businesses in India, from BFSI and telecom to e-commerce and SaaS are under immense pressure to deliver fast, reliable, and seamless digital experiences. With systems becoming more distributed, cloud-native, and AI-driven, Monitoring + Observability have become the backbone of performance, user experience, and revenue protection.
In 2026, enterprises aren’t just looking for dashboards, they need real-time insights, autonomous remediation, AI-powered anomaly detection, deep APM capabilities, and unified observability.
This guide covers the Top 7 Monitoring and Observability Tools in India (2026 Edition) along with features, ideal use cases, pricing insights, and why they matter for modern businesses.
Why Monitoring & Observability Matters
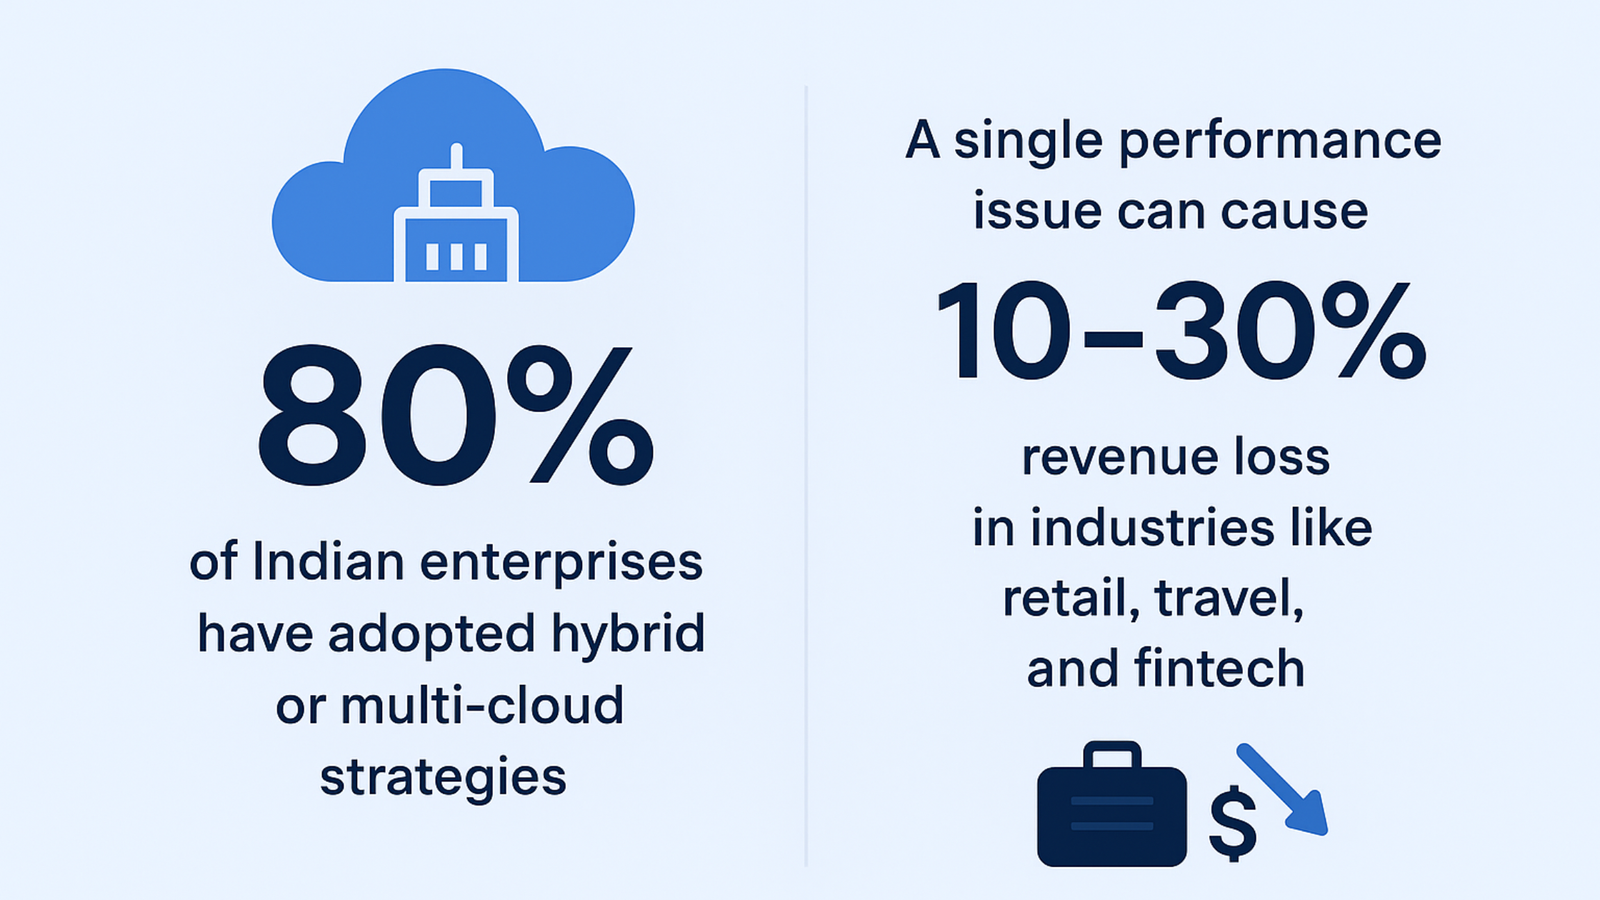
- 80% of Indian enterprises have adopted hybrid or multi-cloud strategies.
- Application complexity has grown due to microservices, containers, serverless components, and distributed systems.
- A single performance issue can cause a 10-30% revenue loss in industries like retail, travel, and fintech.
- Modern users expect apps to load in under 2 seconds, failing which they churn instantly.
- AI-driven monitoring is now a necessity, not a luxury.
Let’s dive into the best tools built for 2026.
Quick Comparison of Top Monitoring & Observability Tools in India (2026)
| Tool | Best For | Strengths | Ideal Company Size |
|---|---|---|---|
| Avekshaa APE/GSMA™ | Mission-critical apps | Deep APM, performance engineering | Large enterprise (India + global) |
| Datadog | Cloud-native teams | Integrations, ease of use | Mid-large |
| New Relic | Engineering teams | Simplified pricing, full stack insights | Startup–mid |
| Dynatrace | Automation at scale | AI-powered RCA | Large |
| Grafana + Prometheus | DevOps-heavy orgs | Open-source flexibility | Mid-large |
| Splunk O11y Cloud | Log-intensive ops | Enterprise logging + monitoring | Large |
| ManageEngine | Cost-conscious orgs | Affordable APM | SMB–mid |
Top 7 Monitoring & Observability Tools in India
1. Avekshaa Technology (India’s Leading Performance Engineering + Observability Platform)
Avekshaa’s APE/GSMA™ platform stands out as one of the most advanced Application Performance Engineering + Observability solutions in India, trusted by major BFSI, telecom, and large enterprises.
Key Capabilities
- End-to-end Application Performance Engineering (APE)
- Full-stack observability for modern cloud-native systems
- Deep-dive RCA with AI-driven anomaly detection
- Performance risk forecasting and capacity planning
- Real-user monitoring and end-to-end business transaction visibility
- Special focus on BFSI, telecom, retail, and mission-critical systems
Best For
Enterprises that need zero-downtime systems, high scalability, and specialized performance engineering along with observability.
2. Datadog (Cloud-Native Observability Leader)
Datadog continues to dominate the cloud-native space and is heavily used by Indian startups, SaaS companies, and mid-enterprise digital teams.
Key Capabilities
- Unified logs, metrics, traces
- 700+ integrations
- Synthetics, APM, RUM, security monitoring
- AI-driven detection and intelligent dashboards
Best For
Teams heavily invested in AWS, Azure, GCP, Kubernetes, serverless, and microservices.
3. New Relic (Developer-Centric Observability Platform)
New Relic’s all-in-one approach makes observability more accessible, especially for engineering teams focused on DevOps and rapid iteration.
Key Capabilities
- 30+ telemetry signals
- Advanced distributed tracing
- Integrated error monitoring
- Highly customizable dashboards
- Full-stack insights
Best For
Product engineering teams looking for a single unified tool with simple pricing.
4. Dynatrace (AI-driven, Autonomous Observability)
Dynatrace remains the most advanced AI-powered observability tool globally, offering automatic discovery, instrumentation, and real-time RCA.
Key Capabilities
- Grail™ unified data lakehouse
- Davis® AI for automated insights
- End-to-end topology mapping
- Automatic dependency detection
Best For
Large enterprises needing autonomous monitoring at scale.
5. Grafana + Prometheus Stack (Open-Source Leader)
The Grafana ecosystem remains the top choice for organizations wanting full control over their observability pipeline.
Key Capabilities
- Metrics collection via Prometheus
- Beautiful custom dashboards via Grafana
- Loki for logs, Tempo for tracing
- Cost-effective, flexible, open-source
Best For
Engineering teams with strong DevOps maturity and those wanting high customizability.
6. Splunk Observability Cloud (Enterprise-Grade Observability)
Splunk remains strong in log analytics and now offers a robust cloud-native observability suite.
Key Capabilities
- High-speed log analysis
- Real-time metrics and traces
- AIOps integrations
- Enterprise-level security insights
Best For
Large enterprises that require log-heavy analytics + observability.
7. ManageEngine Applications Manager (India-Friendly Pricing + Strong APM Features)
ManageEngine offers a cost-effective observability and APM solution tailored for Indian enterprises, SMBs, and IT ops teams.
Key Capabilities
- APM + infrastructure monitoring
- Business transaction monitoring
- Database insights
- Synthetic monitoring
- On-prem support
Best For
Organizations looking for an affordable, scalable alternative to global tools.
Observability vs Monitoring: Why the Distinction Matters for Indian Enterprises in 2026
Many Indian enterprises still use the terms monitoring and observability interchangeably. In practice, the distinction is significant and has direct implications for how teams investigate and resolve production issues.
Traditional monitoring
It relies on predefined metrics and alerts, which means teams only know about problems the system was designed to detect in advance.
Observability
By combining metrics, logs, and distributed traces, observability enables teams to explore unexpected failures in complex distributed systems without needing to have anticipated every failure mode. This is the difference between knowing a payment transaction failed and understanding exactly which microservice, database query, or third-party API introduced the latency that caused it.
For Indian enterprises operating in BFSI, telecom, or retail, this distinction is not academic. A monitoring-only approach may alert your team that transaction success rates are dropping. An observability-first approach tells you it is a specific database connection pool in a specific availability zone that became saturated when UPI traffic spiked. That specificity is what determines whether resolution takes 4 minutes or 4 hours.
Final Thoughts
As Indian enterprises move deeper into cloud, microservices, and AI-driven architectures, monitoring and observability have become foundational pillars of digital reliability. What once served as reactive troubleshooting tools are now proactive intelligence systems that protect revenue, ensure uptime, and improve customer experience.
If you operate in BFSI, telecom, retail, healthcare, or any mission-critical environment, your systems demand near-zero downtime, strict compliance, and real-time performance assurance. In such high-stake industries, choosing platforms like Avekshaa Technologies.
If you’re cloud-native : Datadog or New Relic. If you want open source : Grafana stack is unbeatable.