Application Performance Management (APM) has become essential for enterprises managing complex digital ecosystems. Today’s leaders need more than just basic monitoring; they need APM solutions that can offer insights across every layer—from backend infrastructure to end-user experience.
With more than 76% of businesses experiencing application downtime that impacts customer experience, the stakes for seamless, high-performing applications are undeniable.
But with a crowded APM market, finding the right tool can be challenging. Companies need tools that don’t just diagnose but also optimize, predict, and prevent performance issues.
This guide outlines 2025’s best APM tools, focusing on top picks that offer real-time monitoring, full-stack observability, and advanced diagnostics.
For businesses looking to ensure their applications stay robust and responsive, these tools provide the visibility and control needed to drive uptime and user satisfaction. And if managing these tools in-house feels overwhelming, Avekshaa offers expert APM services to keep your applications running smoothly and efficiently.
What to Look for in an APM Tool
Selecting the right APM tool is about more than feature lists. It’s about finding a solution that aligns with your operational needs and can handle your application’s scale and complexity. Here are four key features top leaders prioritize in APM tools:
Real-Time Monitoring and Custom Alerts
For leaders, time is money, especially in high-stakes environments. APM tools need to offer real-time monitoring across all systems, with custom alerts that notify teams instantly of performance dips or anomalies.
This is crucial when a single minute of downtime can lead to revenue loss or damage to brand reputation.
Full-Stack Observability
Modern applications are complex, with dependencies spanning infrastructure, databases, APIs, and end-user devices. Full-stack observability lets you see everything in one dashboard—from backend to frontend.
This complete view is critical to understanding where issues stem from and ensuring no blind spots in monitoring.
AI-Powered Root Cause Analysis
With rising complexity in systems, relying on manual root cause analysis (RCA) can mean prolonged downtime. Advanced APM tools leverage AI to pinpoint the exact cause of issues within seconds.
This automation minimizes RCA time, letting teams resolve problems faster and avoid recurring issues.
Seamless Integration and Automation
APM tools need to fit seamlessly into existing DevOps workflows. This includes integration with CI/CD pipelines, cloud environments, and existing monitoring tools.
Automation features like auto-scaling and self-healing are also essential for companies aiming for operational efficiency without added manual workload.
Choosing a tool that excels in these areas ensures your applications run smoothly, giving your teams more time to focus on delivering innovation rather than troubleshooting.
Top 12 APM Tools for 2025
Here’s a curated list of 2025’s top APM tools, each known for advanced capabilities, strong integration options, and proven results in real-world scenarios.
#1 New Relic
New Relic is a robust tool for full-stack observability, providing real-time insights and customizable dashboards that make it popular among teams that need quick, actionable data across their applications.
Known for its user-friendly interface, New Relic helps simplify APM for both seasoned DevOps teams and newer users.
Best For: Organizations looking for easy setup and a comprehensive view of application health, ideal for rapid troubleshooting and detailed real-time monitoring.
Why It Stands Out: With integrations across 500+ tools, New Relic adapts to varied tech stacks, making it highly versatile. Its unique NRQL (New Relic Query Language) enables detailed, customized insights into application performance, and it is recognized for strong support documentation.
Pricing:
Free Tier: Includes basic monitoring for up to 100 GB of data per month.
Standard (Pay-as-you-go): Billed per GB of data ingested and queries run.
Pro and Enterprise Plans: Custom pricing for larger organizations with more complex needs. Contact New Relic for specific quotes.
Pros:
User-Friendly Interface: Customizable dashboards and straightforward setup, which many users find intuitive.
Real-Time Monitoring: Timely alerts and actionable insights that help reduce downtime.
Strong Documentation and Support: Documentation and customer support, including OpenTelemetry support, aid in seamless integration and troubleshooting.
Custom Query Language (NRQL): Allows deeper insight customization to meet unique monitoring requirements.
Cons:
Costly at Scale: While ideal for smaller teams, New Relic’s costs can rise significantly as data volumes grow.
Steep Learning Curve: NRQL’s advanced capabilities can be challenging for new users, requiring time to learn effectively.
Limited AI Root Cause Analysis: Some users feel its AI tools are not as effective for pinpointing exact issues in complex, interconnected systems.
#2 Dynatrace
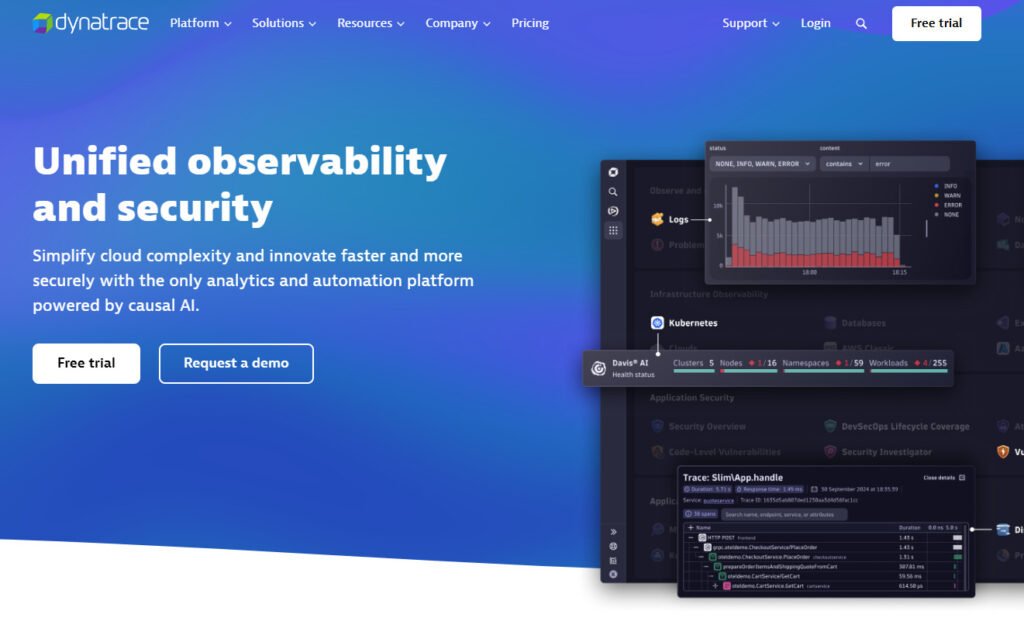
Dynatrace is known for its AI-powered diagnostics and comprehensive full-stack observability, making it an essential tool for organizations managing complex, multi-cloud, or hybrid environments.
With Davis AI, it automatically detects performance bottlenecks and provides root-cause analysis, enabling faster troubleshooting and proactive issue resolution.
Best For: Enterprises with complex, distributed systems that require robust, automated monitoring and high scalability.
Why It Stands Out: The Davis AI engine allows Dynatrace to anticipate performance issues, offering unparalleled visibility across applications and infrastructure. It’s particularly beneficial for DevOps teams focused on real-time performance monitoring and optimization.
Pricing:
Full-Stack Monitoring: Starts at $69 per month per 8 GB host.
Infrastructure Monitoring: Priced at $21 per month per 8 GB host.
Digital Experience Monitoring: Begins at $11 per month for every 10,000 Digital Experience Monitoring units.
Pros:
Comprehensive Observability: Delivers end-to-end insights across the full tech stack, allowing teams to monitor applications, infrastructure, and user experiences in real time.
AI-Driven Problem Detection: The Davis AI engine enables faster root-cause analysis and minimizes the time needed for manual troubleshooting.
Ease of Integration: Supports seamless integration with various platforms, making it adaptable to large-scale and hybrid IT ecosystems.
Cons:
High Cost for Smaller Teams: While excellent for large organizations, Dynatrace’s pricing may be steep for smaller teams or startups.
Steep Learning Curve: Dynatrace offers extensive features, which some users find overwhelming at first. Full mastery requires significant onboarding and training time.
#3 AppDynamics
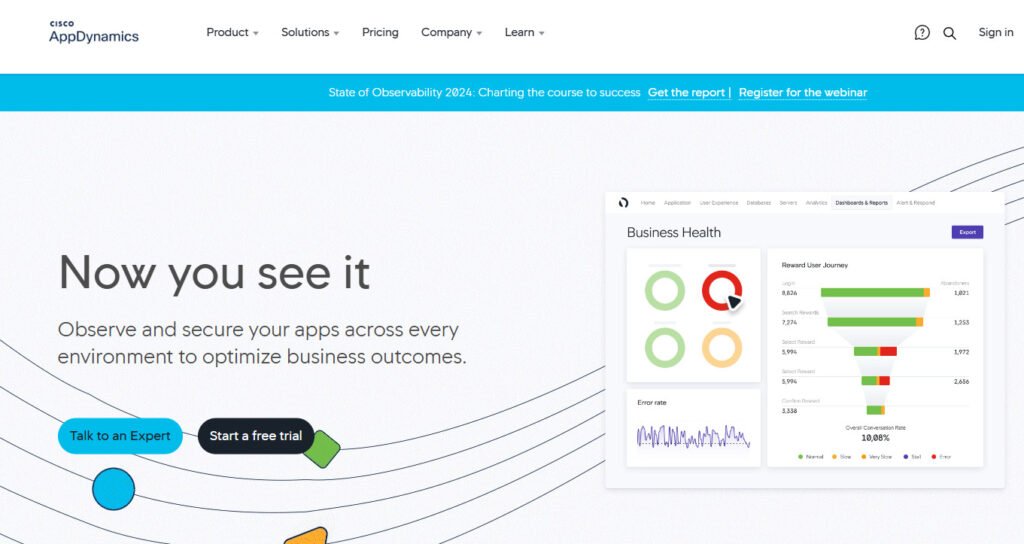
Powered by Cisco, AppDynamics is a comprehensive APM solution designed to provide visibility into application performance through a business-centric lens.
It’s widely used for its ability to detect performance bottlenecks in real-time, helping organizations align application performance with business goals, especially in large-scale, distributed environments.
Best For: Enterprises seeking detailed insights into business transactions and application performance.
Why It Stands Out: AppDynamics is known for its real-time business observability, allowing organizations to correlate application performance data with business outcomes, which is highly beneficial in digital transformation initiatives.
Pricing:
APM Pro: Entry-level plan with essential monitoring.
APM Advanced and APM Peak: Custom pricing for more robust, enterprise-grade features. Contact Cisco’s sales team for specific pricing based on organization size and needs.
Pros:
Detailed Insights into Business Transactions: Provides in-depth visibility into transaction flows, making it easier to track performance and troubleshoot.
Ease of Integration: Works seamlessly with a range of third-party applications, cloud services, and data monitoring tools, which helps streamline workflows.
24/7 Support: Known for responsive customer support, essential for teams requiring round-the-clock reliability.
Cons:
High Cost for Large Organizations: While packed with features, AppDynamics can be more costly than some competitors, which may impact budget-conscious teams.
Complex Interface for New Users: Although powerful, some users find the platform’s extensive features initially overwhelming, requiring time to master effectively
#4 Datadog
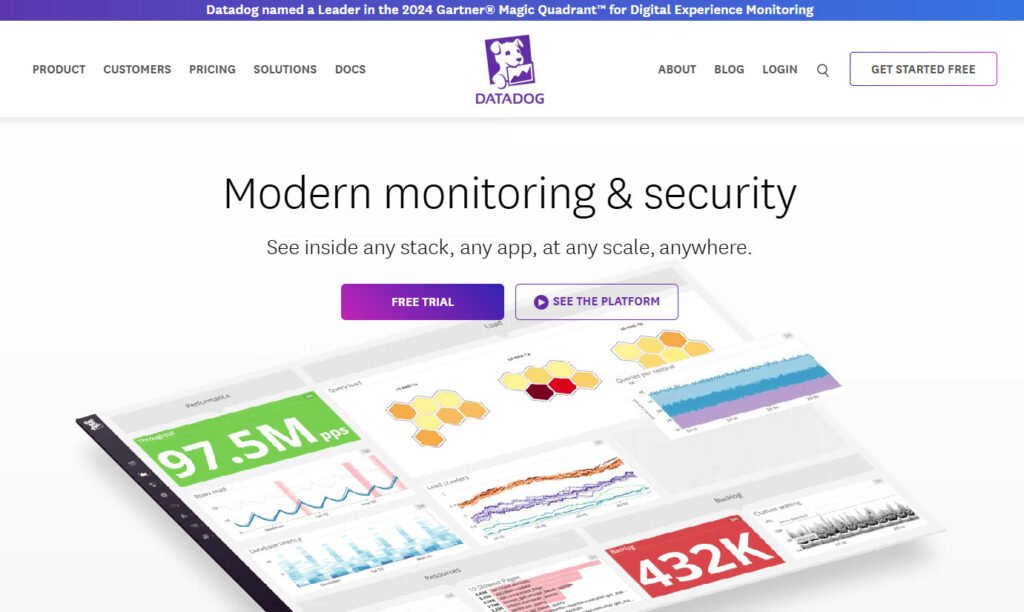
Datadog provides a comprehensive monitoring and security platform tailored for developers, IT operations, and security teams.
It offers full-stack observability across applications, cloud services, and infrastructure in a unified interface, simplifying the monitoring of complex environments, including multi-cloud and hybrid setups.
Best For: Teams that need a centralized monitoring solution with advanced integration capabilities across cloud and on-premise environments.
Why It Stands Out: Datadog excels in real-time monitoring and ease of integration with numerous cloud and on-premises services. It supports automated infrastructure and application monitoring, log management, and seamless alerting capabilities, making it popular among DevOps teams and large enterprises.
Pricing:
Free: $0 per host/month, with limited functionality.
Pro: $15 per host/month for essential monitoring features.
Enterprise: $23 per host/month with advanced capabilities.
Pros:
User-Friendly Interface: Datadog’s UI is frequently praised for its intuitiveness, enabling users to set up dashboards and customize alerts with minimal effort.
Robust Real-Time Monitoring: The platform supports real-time observability across distributed environments, helping teams address issues before they impact users.
Flexible Integrations: Datadog integrates seamlessly with popular platforms like AWS, Kubernetes, and ServiceNow, adding to its utility for large, interconnected systems.
Cons:
Pricing Complexity: Datadog’s pricing model, especially for custom metrics and tags, can be challenging to predict, leading to budgeting difficulties.
Steep Learning Curve: Although the interface is user-friendly, mastering the full range of Datadog’s advanced features often requires significant time and training
#5 SolarWinds Observability
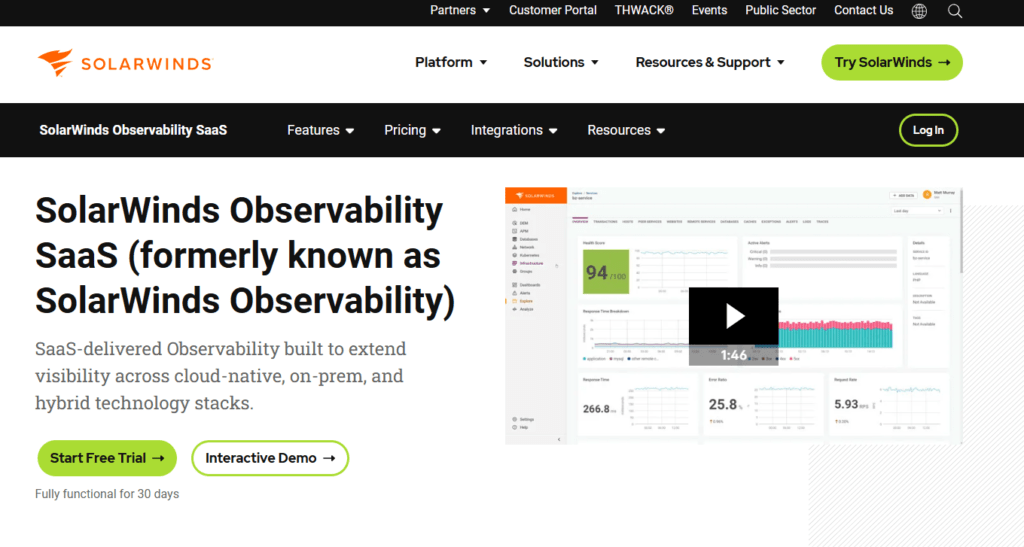
SolarWinds Observability provides end-to-end observability for both cloud and on-premise environments.
It caters to modern enterprises needing deep visibility into their hybrid infrastructures, with features that cover everything from network and application monitoring to security and performance analysis.
Best For: Organizations looking for comprehensive, flexible observability across hybrid IT environments, from SMBs to large enterprises.
Why It Stands Out: With its customizable dashboard, SolarWinds Observability integrates advanced AI/ML capabilities that offer predictive alerts and anomaly detection. It also provides flexible deployment options, supporting both on-premises and SaaS configurations, allowing users to tailor the platform to their unique infrastructure needs.
Free Trial: Available with limited features.
Enterprise Pricing: Customized per user requirements; SolarWinds has flexible pricing options depending on the deployment size and required features.
Pros:
Comprehensive Monitoring: Offers full-stack observability across networks, applications, and databases, which reduces the need for multiple tools.
Flexible Deployment Options: Available as both SaaS and self-hosted, allowing for better integration into varied infrastructure setups.
Built-In AI/ML: Features such as predictive alerting and log analysis powered by AI increase operational efficiency and aid in faster issue resolution .
Cons:
Contup for Advanced Features: Some users report challenges with configuration, especially for more advanced features and integrations.
Pricing and Cost: Pricing can be high for smaller organizations, especially for additional modules and integrations.
Learning Curve: The extensive range of features and configurations can require substantial time to master.
#6 ManageEngine Applications Manager
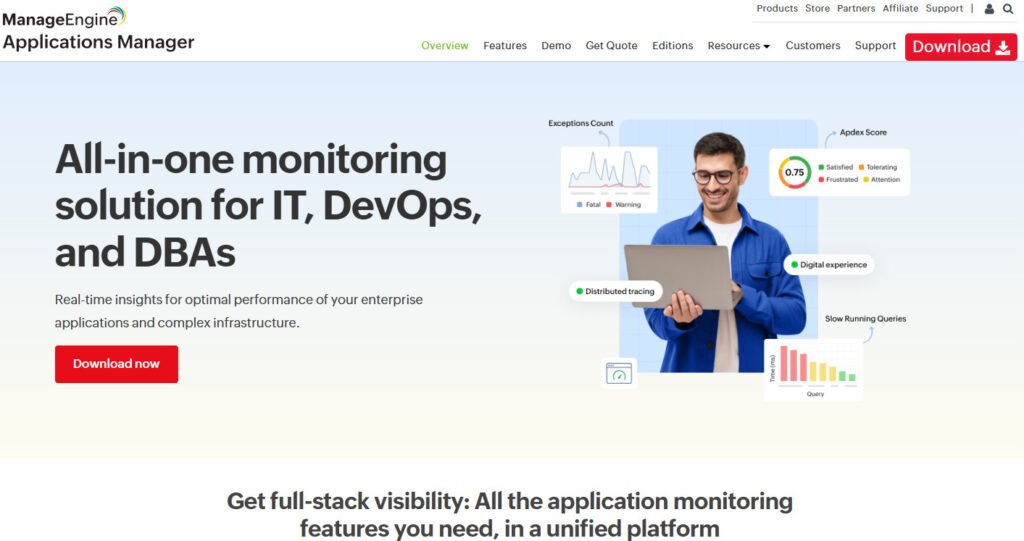
ManageEngine Applications Manager offers comprehensive application and IT infrastructure monitoring with a focus on optimizing end-to-end performance. This tool enables IT and DevOps teams to monitor cloud, hybrid, and on-prem environments from a single console.
It provides insights into application performance, server health, and end-user experience, making it ideal for organizations aiming to ensure seamless operations.
Best For: Small to large enterprises seeking an affordable and intuitive solution for comprehensive application monitoring across diverse IT environments.
Why It Stands Out: Applications Manager supports a broad range of technologies, from on-premise servers (like VMware and Hyper-V) to databases and cloud platforms.
It provides detailed, code-level insights and leverages AI-assisted alerts for proactive issue resolution, reducing downtime.
The platform’s user-friendly dashboard is enhanced with support for over 100 applications and customizable alerting features, which help IT teams respond to issues quickly
Pricing:
Free Trial: Available with basic features.
Enterprise Pricing: Cost-effective, with competitive pricing based on usage needs and infrastructure size .
Pros:
User-Friendly Interface: Simple setup and an intuitive dashboard that enhances usability for IT staff.
Full-Stack Monitoring: Enables monitoring across diverse environments, including cloud, servers, databases, and applications.
Robust Alerting System: Real-time alerts are customizable for different types of notifications (SMS, email, etc.), making it easy to address critical issues.
Cons:
Complex Licensing: Some users find the licensing structure challenging to navigate.
Alert Fatigue: Overly sensitive alerting can result in frequent false positives, requiring manual adjustments.
User Interface Issues: The platform may feel complex for beginners and is resource-intensive when monitoring extensive infrastructures.
#7 Splunk APM
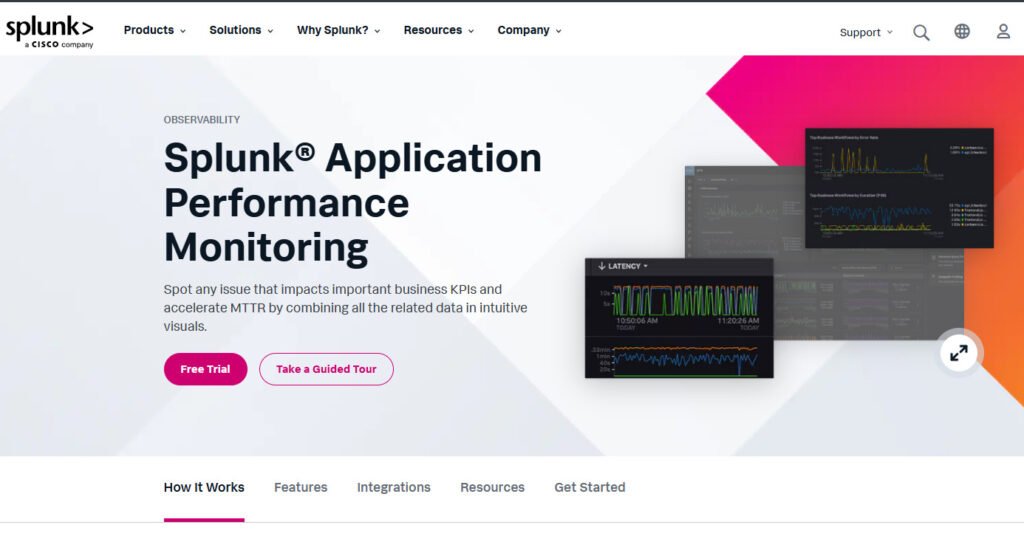
Splunk APM (Application Performance Monitoring) focuses on providing full visibility across applications and infrastructure, particularly in complex, cloud-native, and microservices environments.
Leveraging full-fidelity trace analysis, AI-driven troubleshooting, and OpenTelemetry standardization, Splunk APM helps development and operations teams detect, analyze, and resolve performance issues more efficiently.
Best For: Organizations with large, distributed systems or microservices architectures that require comprehensive trace analysis and cloud-native observability.
Why It Stands Out: Splunk APM emphasizes high-fidelity tracing and “AlwaysOn” profiling, allowing engineers to continuously monitor code-level performance bottlenecks.
Its integration with the broader Splunk ecosystem also provides flexibility for teams to monitor logs, events, and infrastructure in one platform, which enhances troubleshooting and enables deeper data analysis. This cross-platform compatibility makes it popular for IT and security teamsng.
Free Trial: Splunk APM offers a trial to explore features.
Enterprise Pricing: Pricing varies significantly based on data volume, with some users noting that it can be cost-prohibitive at scale.
Pros:
High-Fidelity Tracing and Analytics: Full-fidelity trace analysis and AlwaysOn profiling offer detailed insights into application performance issues.
AI and Machine Learning: AI-driven alerts and root cause analysis improve proactive issue detection.
Customizable Dashboards and Alerts: Splunk APM allows extensive customization, making it easier to manage and visualize performance data.
Cons:
Conning Curve: For beginners, Splunk’s configuration and query setup can be challenging due to its complex interface and reliance on custom expressions.
High Cost: Some users report that Splunk’s pricing can be high, especially with large data volumes in cloud or distributed environments.
Troubleshooting Complexity: While Splunk APM is powerful, it requires users to understand advanced expressions and configurations to optimize its full potential .
#8 Raygun
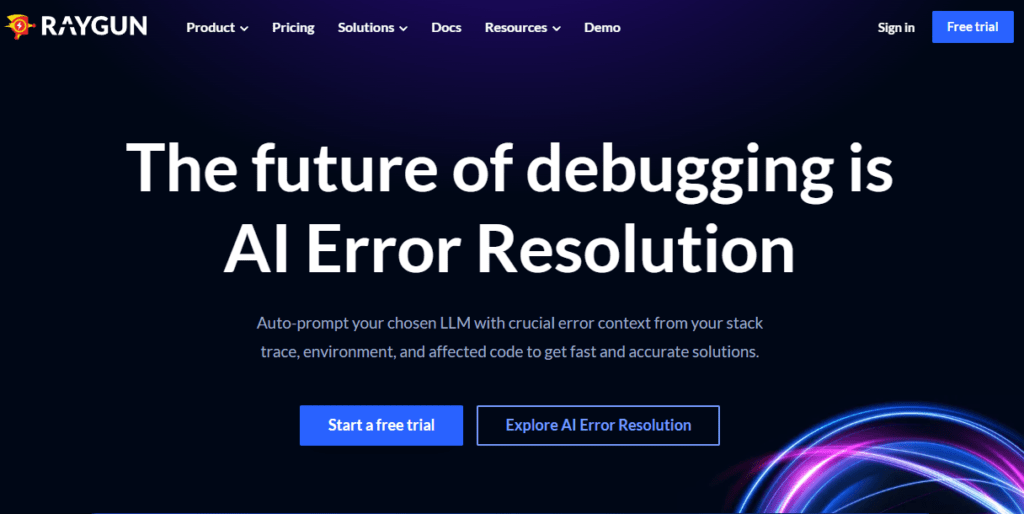
Raygun specializes in digital experience monitoring with a focus on error and crash reporting, real-user monitoring, and application performance monitoring (APM). Raygun aims to improve software quality by identifying errors in real-time, enabling businesses to resolve issues proactively before they affect users.
With features like crash diagnostics, user experience insights, and server-side performance tracking, Raygun helps teams maintain smooth application functionality.
Best For: Development teams needing a lightweight, real-time monitoring tool for both error tracking and customer experience insights, particularly in environments where quick debugging and resolution are essential.
Key Features:
Crash Reporting: Allows engineers to track and address bugs with granular diagnostics that pinpoint the root cause down to specific lines of code, significantly reducing debugging time.
Real User Monitoring (RUM): Monitors user experience across devices and browsers, enabling teams to proactively manage user-related performance issues.
Application Performance Monitoring (APM): Provides a comprehensive view of server-side performance, detailing execution time and code-level traces to locate bottlenecks effectively.
Pricing:
Crash Reporting: Starting at $40 per month.
Real User Monitoring: Starting at $80 per month.
APM: Starting at $80 per month.
Free Trial: Raygun offers a free trial for prospective users to explore its features.
Pros:
Granular Error Tracking: Detailed error diagnostics down to the code level, with automated alerts to maintain a strong customer experience.
User-Friendly Interface: Users praise Raygun’s clean interface, which simplifies error monitoring and performance tracking.
Rapid Issue Identification: Real-time alerts and dashboards help teams stay ahead of application issues and prevent downtime.
Cons:
Complex Setup for Certain Features: Initial configuration may be challenging, particularly for users needing customization.
Pricing Considerations: Raygun can be costly for smaller businesses or startups, particularly with the APM and RUM features.
Limited Customization Options: Users have reported limitations with customizing specific features, potentially reducing flexibility for unique monitoring needsto explore any specific use cases or comparisons for Raygun.
#9 SigNoz
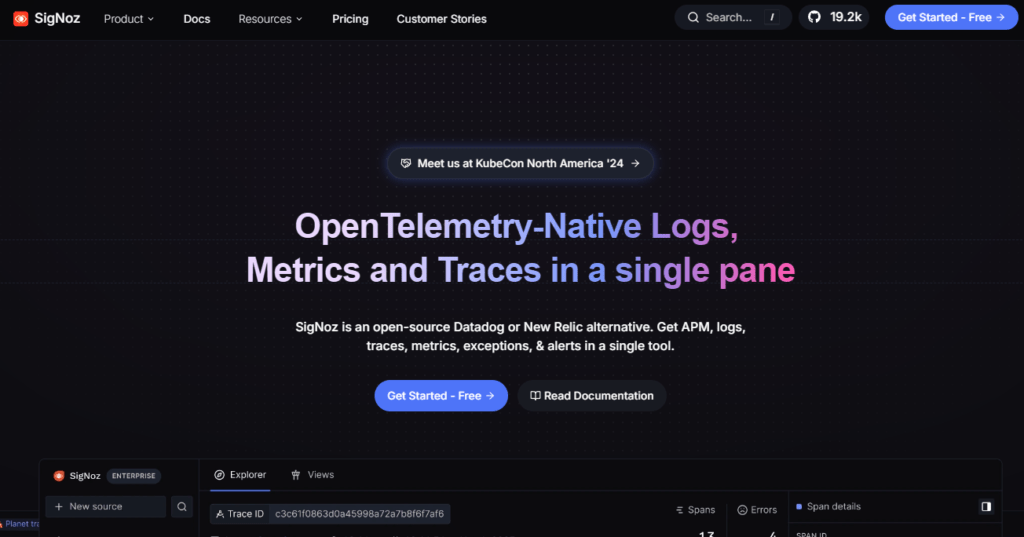
SigNoz is an open-source observability platform that provides an alternative to major Application Performance Monitoring (APM) tools like Datadog and New Relic.
SigNoz combines application performance monitoring, log management, distributed tracing, and error tracking within a single platform.
Designed with OpenTelemetry support, SigNoz allows users to track metrics, traces, and logs in a consolidated interface, ensuring developers have all observability data in one place.
Target Users: SigNoz is especially appealing to development teams and DevOps professionals seeking a cost-effective, open-source observability tool that supports OpenTelemetry.
Teams that prioritize full observability across complex, distributed applications and want to avoid vendor lock-in with proprietary tools find SigNoz particularly beneficial.
Key Features:
Application Performance Monitoring (APM): Provides detailed insights into application performance, helping teams identify and resolve performance bottlenecks.
Distributed Tracing: Tracks requests across services, enabling root cause analysis in distributed systems.
Log Management: Supports scalable log ingestion, allowing teams to search and analyze logs across their systems.
Error Tracking: Automatically captures exceptions, complete with stack traces and linked span data for faster debugging.
Customizable Dashboards: Offers infrastructure monitoring, configurable dashboards, and custom metrics for diverse use cases.
Alerts and Notifications: Integrates with popular alerting systems, enabling real-time notifications and proactive issue management.
OpenTelemetry Support: Built from the ground up to support OpenTelemetry, making it a future-proof choice for observability in cloud-native environments.
Deployment Options:
Self-hosted: For teams with specific security or compliance needs, SigNoz offers a self-hosted option.
Cloud: Managed cloud services are available for teams wanting simplified, scalable observability without infrastructure overhead.
Pricing Model: SigNoz stands out with a transparent, usage-based pricing model:
No per-user pricing: Allows unlimited team members without additional costs.
No host-based pricing: Eliminates concerns about auto-scaling costs, especially beneficial for dynamic environments.
Standardized metric pricing: Priced at $0.1 per million samples, offering a cost-effective alternative to traditional APM tools.
Pros:
Open Source: Avoids vendor lock-in and integrates with various platforms and services seamlessly.
Flexible and Scalable: With options for self-hosting, SigNoz adapts to large data ingestion requirements.
High Developer Engagement: SigNoz enjoys robust community support, with over 18,000 stars on GitHub and extensive documentation.
Cons:
Complex Setup for Some Use Cases: Initial setup for full observability can require configuration, particularly for complex use cases.
Limited Ecosystem Compared to Major Players: While growing, the ecosystem is still maturing relative to more established tools like Datadog.
#10 Sentry
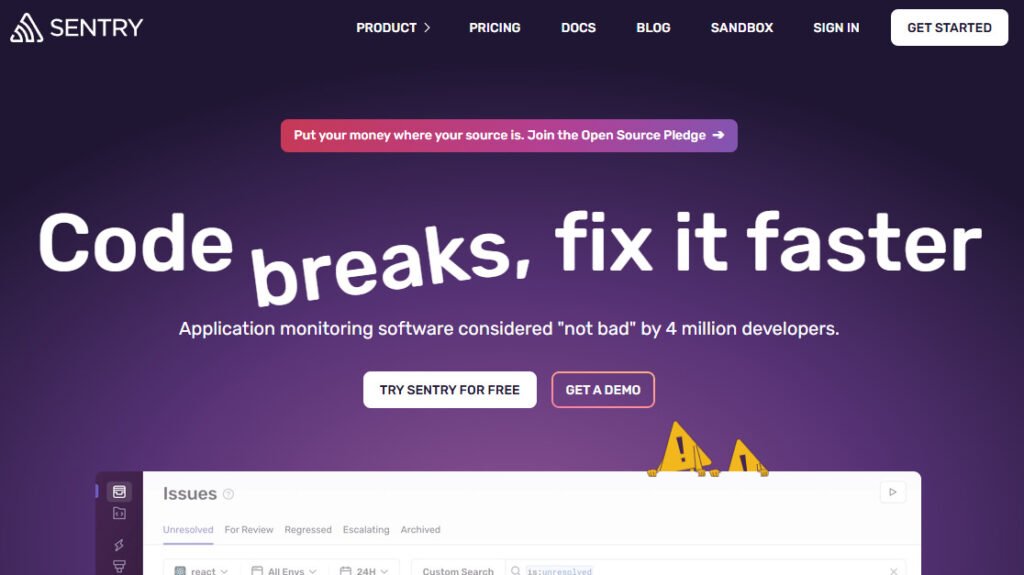
Sentry is a leading tool in the DevOps and software development space, providing powerful capabilities for error tracking, performance monitoring, and code-level observability.
Originally focused on error tracking, Sentry has evolved into a comprehensive platform that supports monitoring across frontend and backend codebases, helping developers identify and resolve bugs swiftly.
Its integrations with CI/CD tools streamline debugging and ensure applications maintain optimal performance. Notably, Sentry is embraced by large companies like Disney, Slack, and Cloudflare, making it a trusted choice in application monitoring.
Target Users: Sentry caters to software development teams and DevOps engineers aiming to maintain high application reliability and quick error resolution.
Its user-friendly approach and robust integrations make it ideal for companies of all sizes—from startups to large enterprises—needing real-time insights and error resolution.
Key Features:
Error Tracking: Detects errors and provides insights down to the exact line of code, allowing developers to act on issues before they impact end users.
Performance Monitoring: Offers tools like distributed tracing and performance analysis, giving visibility into bottlenecks and slowdowns in frontend and backend applications.
Session Replay: Recently introduced, this feature records user sessions, enabling teams to understand how errors affect user experience.
Seamless Integrations: Works with GitHub, JIRA, Slack, and other platforms to create a connected workflow.
Granular Alerts and Notifications: Configurable alerts for escalating issues, helping teams stay informed without overwhelming them with notifications.
Deployment and Pricing Options:
Cloud-based and On-premises: Flexible deployment to suit varied security and compliance needs.
Pricing Tiers: Offers a free Developer plan, with premium options starting at $26 per month for Team plans, and Enterprise options with custom pricing for larger organizations.
Pros:
Ease of Use: Known for quick setup, Sentry’s intuitive UI allows for easy integration and navigation, making it accessible to development teams.
Comprehensive Error Insights: Provides detailed stack traces and error insights, making bug resolution faster and more efficient.
Supports High Adoption Rate: With extensive community support, the platform is continuously evolving with user-driven features and improvements.
Cons:
Pricing Complexity: For some users, the tiered pricing structure and error quota limits can be restrictive, especially for projects generating large volumes of errors.
Feature Limitations in Lower Tiers: Certain features, such as advanced insights, are only available in higher-priced plans.
Comparative Positioning
In the observability market, Sentry competes with major APM tools like Raygun, SigNoz, and Datadog, particularly excelling in error tracking but now extending to performance monitoring and session replay capabilities.
It distinguishes itself by focusing on developer ownership and code-level insights, whereas other platforms may provide a more generalized APM experience.
#11 Stackify Retrace
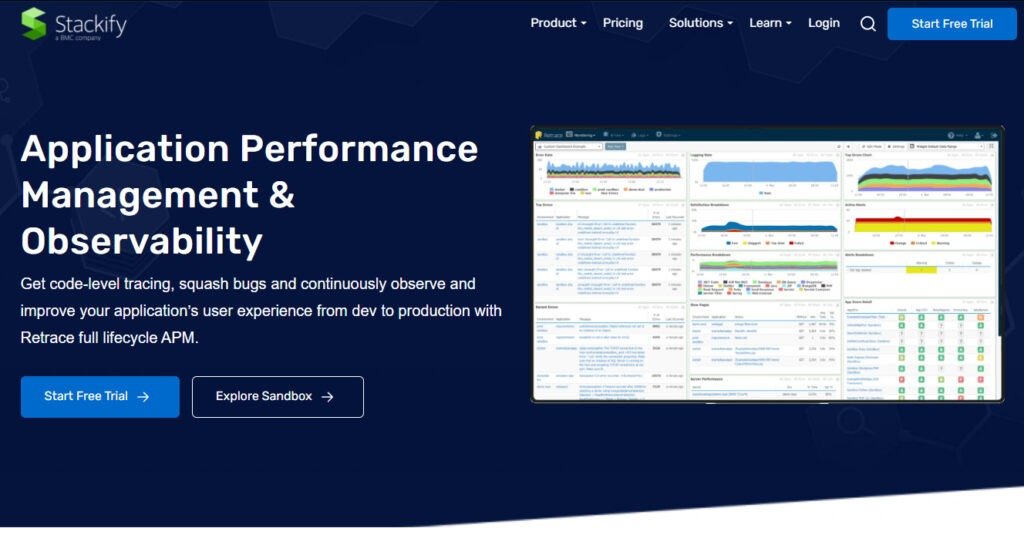
Retrace by Netreo is an advanced Application Performance Management (APM) tool that offers a comprehensive suite for monitoring, error tracking, and logging to ensure seamless application performance across the software lifecycle.
Originally designed to fill gaps in the monitoring space, Retrace is built to detect performance issues and pinpoint their root causes by integrating code profiling, SQL query monitoring, and log management.
The tool is lightweight and capable of supporting development workflows from pre-production to deployment, making it suitable for DevOps teams needing a unified view of their application stack.
Target Audience: Retrace is well-suited for DevOps engineers, developers, and IT operations teams who require detailed insights into application performance and want to address potential issues before they impact users.
It is ideal for mid-sized to large organizations looking to manage cloud-based or on-premises applications.
Key Features:
Code Profiling and Error Detection: Lightweight code profiling allows developers to see how each part of the application performs, making it easier to spot bottlenecks.
SQL Query Monitoring: Detailed tracking of SQL queries to ensure efficient database interactions and optimize query performance.
Integrated Log Management: Collects and analyzes logs from various frameworks to provide comprehensive insights into application behavior and exceptions.
Lifecycle Coverage: Supports pre-production, testing, and production stages, providing visibility into app health at every phase.
Unlimited Users: Supports multiple team members without additional licensing, allowing cross-functional collaboration.
Pricing and Deployment:
Essentials: Starts at $99 per month, offering unlimited user access.
Standard and Enterprise Plans: Standard plans begin at $249 per month, with enterprise options available upon request for more extensive support and advanced features.
Pros:
High Customizability: Allows in-depth configuration of monitoring parameters and integrates seamlessly with various development tools.
Fast Setup and Onboarding: Designed for rapid setup and easy agent deployment in cloud or on-premises environments.
Detailed SQL and Error Insights: Provides granular insights into SQL queries, errors, and exceptions, which helps in effective debugging.
Cons:
Complex Interface: Some users find the interface cluttered and challenging, especially for teams new to the platform.
Performance Overhead: Some users report that intensive log and query monitoring can impact system performance, particularly with high transaction volumes.
Comparative Positioning
Stackify Retrace is often compared to APM tools like AppDynamics, Datadog, and Dynatrace, especially for error tracking and database query monitoring.
However, Retrace is known for its deeper code-level insights and developer-centric features such as in-depth SQL monitoring, making it an attractive option for development teams focused on application diagnostics and database optimization.
#12 Elastic APM
Elastic APM offers a real-time view into the health of your applications. Part of the Elastic Stack, it integrates with Elasticsearch and Kibana, allowing teams to monitor response times, database queries, and API calls in one centralized platform.
This integration gives Elastic APM users powerful data visualization and the ability to troubleshoot issues quickly, often from the same dashboard they use for broader operational insights.
Features & Capabilities:
Real-Time Monitoring: Elastic APM provides immediate insight into application performance, logging crucial data such as response times and error rates. Its user-friendly charts in Kibana make it easy for teams to pinpoint issues at a glance.
Detailed Transaction Tracing: Tracks database queries, cache calls, and external HTTP requests, delivering a breakdown of transactions to show how different components impact performance.
User-Friendly Interface: Users report that Kibana’s charts are intuitive, helping users quickly assess application health without complex setups.
Pros:
Ease of Use: Elastic APM is praised for its user-friendly design and smooth setup. Many reviews highlight the efficiency of Kibana’s visualization tools.
Effective Troubleshooting: Transaction traces and performance metrics offer in-depth insights into specific issues.
Cons:
Limited Customization: Elastic APM lacks some advanced configuration options, making it challenging for users who need deeper customizations.
Support and Learning Curve: Limited customer support and documentation make it harder for new users to resolve complex issues quicklyosition**: Elastic APM is frequently compared to Grafana Labs, Sentry, and Dynatrace for its visualization and real-time monitoring.
It’s especially appealing to teams already using the Elastic Stack but might be limited in its standalone APM features compared to some dedicated APM tools.
How Avekshaa Enhances Application Performance Management
For businesses looking to get the most out of their APM tools, Avekshaa Technologies provides comprehensive Application Performance Management services tailored to optimize performance, availability, and scalability. Here’s how Avekshaa adds value beyond traditional APM tools:
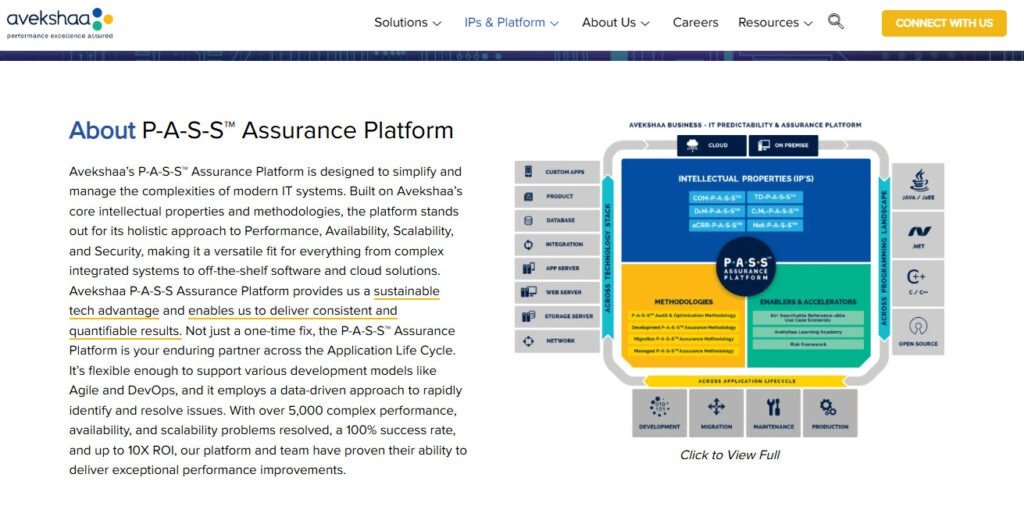
Proactive Monitoring with P-A-S-S™
Avekshaa’s unique P-A-S-S (Performance, Availability, Scalability, Security) framework goes beyond traditional monitoring by actively identifying and preventing issues before they escalate. By optimizing the entire tech stack, Avekshaa improves end-user experience, with results such as a 25-30% increase in response time for critical applications.
End-to-End Observability Across the Stack
With full-stack observability, Avekshaa provides visibility from infrastructure and databases to the end-user interface. This allows Avekshaa’s team to manage application health holistically, ensuring systems run seamlessly across all layers, from backend to frontend.
Optimized RCA with AI and Predictive Insights
By leveraging AI and predictive analytics, Avekshaa reduces RCA time and helps clients avoid downtime or degraded performance. Avekshaa’s methods have reduced client support calls by 95% in production applications, boosting customer satisfaction.
Seamless Integration with Leading APM Tools
Avekshaa works with top APM tools like Dynatrace, AppDynamics, and Datadog, offering expertise in configuration, monitoring, and proactive management. For companies that lack in-house resources, Avekshaa’s team delivers tailored APM solutions that adapt to changing demands, ensuring applications stay robust and responsive.
In-House vs. Outsourced APM Management: Making the Right Choice
Choosing between in-house APM and partnering with an external provider is a strategic decision for many companies.
When In-House APM is Beneficial
An in-house APM team is ideal for organizations with large IT departments and a constant need for application performance optimization. Companies in highly regulated sectors may prefer in-house management for tighter data control and compliance.
However, building an effective APM team requires significant investment in both talent and infrastructure.
Why Partnering with Avekshaa is a Smart Choice
For companies looking to avoid the overhead of an in-house team, Avekshaa offers a cost-effective alternative. Avekshaa’s proactive approach, powered by advanced tools and expertise, provides the benefits of comprehensive APM without the added burden. By partnering with Avekshaa, businesses can:
Achieve Scale on Demand: Avekshaa’s team scales services up or down as needed, allowing clients to handle peak loads or new projects without staffing concerns.
Access Proven Expertise: With a track record of over 5,000 resolved performance issues, Avekshaa brings specialized skills in APM and root cause analysis.
Optimize Cost and Efficiency: With Avekshaa, clients gain the efficiency of an outsourced model without the high costs of in-house management.
For companies ready to take their APM to the next level, Avekshaa offers the perfect blend of proactive solutions and industry-leading tools, helping businesses maintain high performance and customer satisfaction across their digital ecosystems.
The Power of Strategic APM for Business Success
Application Performance Management isn’t just about minimizing downtime; it’s about ensuring a seamless, high-quality experience for users and protecting business-critical applications from costly disruptions.
The tools highlighted in this article represent the best of APM in 2025, offering solutions that provide deep insights, full-stack observability, and advanced analytics to keep applications running at peak performance.
However, even the best tools require skilled management to unlock their full potential. This is where Avekshaa Technologies adds unique value.
By combining APM expertise with its proactive P-A-S-S™ (Performance, Availability, Scalability, Security) framework, Avekshaa helps businesses go beyond traditional monitoring to proactively manage and optimize their digital ecosystems.
Avekshaa works seamlessly with top APM tools like Dynatrace, AppDynamics, and Datadog, providing tailored APM solutions that adapt to your specific requirements.
For organizations looking to enhance application resilience, scalability, and user experience without the overhead of building an in-house team,
Avekshaa’s proven expertise in APM delivers both cost-efficiency and peace of mind.
Whether you need support with tool implementation, ongoing monitoring, or end-to-end observability, Avekshaa is here to partner with you in driving performance excellence.
Disclaimer: The pros and cons listed here are derived from user feedback and aggregated online sources like G2. If you notice any inaccuracies or have further inquiries, please reach out to us directly.


